tuning
Passing kernel module parameters in Ubuntu 8.10
Sorry for the mouthful of a title but I wanted to use something that would show up for the kind of queries I was firing into Google yesterday in a vain attempt to solve my problem.
A little background first: I’m working with some SuperMicro Twin systems (basically, two system boards in a single 1U chassis sharing a power supply – not as compact as a blade but not bad) which includes a nVidia MCP55V Pro Chipset Dual-port LAN / Ethernet Controller. On Ubuntu 8.10 at least, this uses the forcedeth driver (originally a cleanroom implementation of a driver which competed with a proprietary offering from Nvidia – it now seems to have superceded that driver).
I noticed while doing large network transfers to or from one of these machines that the load on the machine seemed to spike. Running dmesg show a lot of these messages,
[1617484.523059] eth0: too many iterations (6) in nv_nic_irq.
[1617484.843113] eth0: too many iterations (6) in nv_nic_irq.
[1617484.869831] eth0: too many iterations (6) in nv_nic_irq.
[1617485.101377] eth0: too many iterations (6) in nv_nic_irq.
[1617485.855067] eth0: too many iterations (6) in nv_nic_irq.
[1617485.896692] eth0: too many iterations (6) in nv_nic_irq.
Google returns lots of results for this message – some people seem to have experienced complete lockups while others noted slowdowns. The proposed solution seems to be to pass the max_interrupt_work option to the forcedeth kernel module to increase the maximum events handled per interrupt. The driver seems to default to running in throughput mode where each packet received or transmitted generates an interrupt (which would presumably ensure the fastest possible transfer of the data) but can also be configured to operate in CPU mode (aka poll mode) where the interrupts are controlled by a timer (I’m assuming this makes for higher latency of transfers but smoother before for high network loads – the documentation on this is a little thin). This behaviour is controlled by the optimization_mode option. You can investigate the options which can be passed to any kernel module by running,
modinfo <module name>
for example,
modinfo forcedeth
So, as an initial pass at tuning the behaviour on the server, I decided to pass the following options to the forcedeth driver.
max_interrupt_work=20 optimization_mode=1
The standard way on Ubuntu 8.10 to set kernel module parameters is to add a line to /etc/modprobe.d/options like the following
options forcedeth max_interrupt_work=20 optimization_mode=1
I tried this and then tried rebooting my system but found it didn’t have any effect (I started seeing the same error messages after running a large network transfer and the max iterations were still referenced as 6 rather than the 20 I should be seeing if my options were parsed).
After trying a few things and brainstorming with the good people on #ubuntu-uk I figured out that you need to run the following command, after modifying /etc/modprobe.d/options
sudo update-initramfs -u
This presumably updates the initramfs image to include the specified options. It is possible this is only needed for modules that are loaded early on in the boot process (such as the network driver) – I haven’t had the need to modify other kernel modules recently (and this stuff seems to change subtly between distributions and even versions).
Following another reboot and a large network transfer, the error messages suggesting that the options are now being parsed (some kernel modules allow you to review the parameters currently being used by looking in the file /sys/modules/<module name>/parameters but forcedeth doesn’t seem to support this).
I figured the trick with update-initramfs was worth publishing for the next person who runs into this problem. I’d also love to hear from others using the forcedeth driver as to what options they find useful to tune the throughput.
What a difference a Gig makes
We’re working on a project at the moment that involves deploying various Linux services for visualising Oceanographic modelling data using tools such as Unidata’s THREDDS Data Server (TDS) and NOAA/PMELS’s Live Access Server (LAS). TDS is a web server for making scientific datasets available via various protocols including plain old HTTP, OPeNDAP which allows a subset of the original datasets to be accessed and WCS. LAS is a web server which, using sources such as an OPeNDAP service from TDS, allows you to visualise scientific datasets, rendering the data overlaid onto world maps and allowing you to select particular variables from the data which you are interested in. In our case, the datasets are generated by the Regional Ocean Modeling System (ROMS) and include variables such as sea temperature and salinity at various depths.
The data generated by the ROMS models we are looking at uses a curvilinear coordinate system – to the best of my understanding (and I’m a Linux guy, not an Oceanographer, so my apologies if this is a poor explanation) since the data is modelling behaviour on a spherical surface (the Earth) it makes more sense to use the curvilinear coordinate system. Unfortunately, some of the visualisation tools, in particular LAS prefers to work with data using a regular or rectilinear grid. Part of our workflow involves remapping the data from curvilinear to rectilinear using a tool called Ferret (also from NOAA). Ferret does a whole lot more than regridding (and is, in fact, used under the hood by LAS to generate a lot of the graphical output of LAS) but in our case, we’re interested mainly in its ability to regrid the data from one gridding system to another. Ferret is an interesting tool/language – an example of the kind of script required for regridding is this one from the Ferret examples and tutorials page. Did I mention we’re not Oceanographers? Thankfully, someone else prepared the regridding script, our job was to get it up and running as part of our work flow.
We’re nearly back to the origins of the title of this piece now, bear with me!
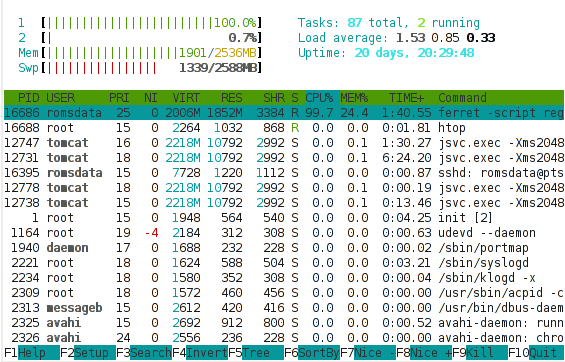
We’re using a VMware virtual server as a test system. Our initial deployment was a single processor system with 1 GB of memory. It seemed to run reasonably well with TDS and LAS – it was responsive and completed requests in a reasonable amount of time (purely subjective but probably under 10 seconds if Jakob Nielsen’s paper is anything to go by). We then looked at regridding some of the customer’s own data using Ferret and were disappointed to find that an individual file took about 1 hour to regrid – we had about 20 files for testing purposes and in practice would need to regrid 50-100 files per day. I took a quick look at the performance of our system using the htop tool (like the traditional top tool found on all *ix systems but with various enhancements and very clear colour output). There are more detailed performance analysis tools (include Dag Wieers excellent dstat) but sometimes I find a good high-level summary more useful than a sea of numbers and performance statistics. Here’s a shot of the htop output during a Ferret regrid,

What is interesting in this shot is that
- All of the memory is used (and in fact, a lot of swap is also in use).
- While running the Ferret regridding, a lot of the processor is being spent in kernel activity (red) instead of normal (green) activity.
High kernel (or system) usage of the processor is often indicative of a system that is tied up doing lots of I/O. If your system is supposed to be doing I/O (a fileserver or network server of some sort) then this is good. If your system is supposed to be performing an intensive numerical computation, such as here, we’d hope to see most of the processor being used for that compute intensive task, and a resulting high percentage of normal (green) processor usage. Given the above it seemed likely that the Ferret regridding process needed more memory in order to efficiently regrid the given files and that it was spending lots of time thrashing (moving data between swap and main memory due to a shortage of main memory).
Since we’re working on a VMware server, we can easily tweak the settings of the virtual server and add some more processor and memory. We did just that after shutting down the Linux server. We restarted the server and Linux immediately recognised the additional memory and processor and started using that. We retried our Ferret regridding script and noticed something interesting. But first, here’s another shot of the htop output during a Ferret regrid with an additional gig of memory,
What is immediately obvious here is that the vast majority of the processor is busy with user activity – rather than kernel activity. This suggests that the processor is now being used for the Ferret regridding, rather than for I/O. This is only a snapshot and we do observe bursts of kernel processor activity still, but these mainly coincide with points in time when Ferret is writing output or reading input, which makes sense. We’re still using a lot of swap, which suggests there’s scope for further tweaking, but overall, this picture suggests we should be seeing an improvement in the Ferret script runtime.
Did we? That would be an affirmative. We saw the time to regrid one file drop from about 60 minutes to about 2 minutes. Yes, that’s not a typo, 2 minutes. By adding 1 GB of memory to our server, we reduced the overall runtime of the operation by 97%. That is a phenomenal achievement for such a small, cheap change to the system configuration (1GB of typical system memory costs about €50 these days).
What’s the moral of the story?
- Understand your application before you attempt tuning it.
- Never, ever tune your system or your application before you understand where the bottlenecks are.
- Hardware is cheap, consider throwing more hardware at a problem before attempting expensive performance tuning exercises.
(With apologies to María Méndez Grever and Stanley Adams for the title!)
Categories
Archives
- September 2010
- February 2010
- November 2009
- September 2009
- August 2009
- June 2009
- May 2009
- April 2009
- March 2009
- February 2009
- January 2009
- October 2008
- September 2008
- August 2008
- July 2008
- June 2008
- May 2008
- April 2008
- March 2008
- February 2008
- November 2007
- September 2007
- April 2007
- March 2007
- February 2007
- January 2007
- December 2006
- September 2006
- July 2006
- June 2006
- April 2006